The Secret Language of Comics

X-Page Exercises: Reading and/or Writing

This is a pre-writing exercise that is designed to help you prepare to complete your first quest, writing the literacy narrative. I’ve adapted this exercise from the Lynda Barry’s “x-page” warmup exercise in the book Syllabus. It should take you 45 minutes to an hour to complete this exercise.

I’m going to describe the steps in text below and I will also include an audio recording of me reading these instructions out loud and pausing for you to write in response. You might find it helpful to play the audio and simply write in a notebook or type on your laptop as you listen instead of having to come back and read text as we go — if nothing else, it might stop you from spending longer on the steps than you need to, so I suggest you try it. If the audio is not helpful for you, for any reason, then you can read the same instructions below.

Audio Prompt for this assignment

Ten Memories

Think back over the course of your life so far and make a list of ten memories that you associate with reading and/or writing. Just take about 3 minutes and make a numbered list of ten memories that come to mind.

Pick One

Then, read over your list and pick the one memory that seems the most vivid to you. Circle it. Then on a new page, write that memory at the top of the page as if it were the title of a story and draw a big X across the page. (If you’re typing on a laptop, the big X is optional)

Twenty Questions

Picture yourself in the memory that you are exploring and then write the answers to the following questions anywhere on the page. Pretend we are having a conversation, so you can see the image but I can’t so I’m going to be asking you these questions to help me “see” the image too. Keep writing until the next question is asked — no detail is too small or unimportant.

  1. Where are you?
  2. What time of day or night does it seem to be?
  3. What season does it seem to be?
  4. Where is the light coming from?
  5. What kind of light is it?
  6. What’s the temperature like?
  7. What does the air smell like?
  8. What are you doing?
  9. Is there anyone else in that place with you?
  10. What are they doing?
  11. Why are you there?
  12. What are some of the sounds you can hear?
  13. What are some of the things you can see?
  14. What’s directly in front of you?
  15. If you turn your head to your right, what’s there?
  16. If you turn your head to the left, what do you see?
  17. What is behind you?
  18. What’s below you and around your feet?
  19. What’s above your head?
  20. What emotions are you feeling in this space?

Once you have jotted answers to those 20 questions on your x-page turn to a new page and freewrite for 10 minutes about that memory. There are no wrong or right things to write about or ways to write about the memory. Just start by elaborating further about any of the details you jotted down on the x-page and then keep writing without stopping about whatever thoughts are coming to your head about that memory. Try not to censor yourself or worry about the quality of what you’re writing. At this stage, all you are doing is generating ideas — you will think about structure and wording later.

Now look back at your original list of ten memories. Are there any other memories that you’d really like to explore further? You don’t need to repeat the entire process described above for the memory (though you can, if it seems like it would be useful) but do jot down some thoughts about any of the other memories on your list that seem worth thinking more about right now.

Building from Memories, Asking Questions

Now that you’ve taken the time to write about one or more of those memories, pause to consider the following questions about your history with reading and writing. They may or may not directly connect with the freewriting you just completed. Jot down brief responses to these questions:

  • How did you feel about reading and writing as an adolescent — say, during middle and high school? What sorts of experiences did you have as a reader and writing in school?
  • What are your experiences with social networking sites like blogs, Facebook, Twitter, or others? What do you remember about your first experiences with such sites? Do you text on a smartphone? What sorts of experiences have you had writing to/for people with those sorts of technologies?
  • What are some of the biggest struggles you have had as a reader and/or writer?
  • What are some of your best moments as a writer?

Sketch 2: Sunday Sketches

Due: 9/3
Tag: sk2

Christoph Niemann is an illustrator, artist, and author whose work regularly appears in the New York Times, the New Yorker, and elsewhere. He’s got a mixed media series that he calls “Sunday Sketches,” in which he takes some object from his surroundings and creates a sketch on the page around it. Some of the best such works he’s included in his book entitled Sunday Sketching.

Some examples from Niemann’s Tumblr:

You can see that each of these pieces is an actual three-dimensional tangible object placed into a drawing on paper to transform that object into something new. Niemann then photographs the resulting sketch to create a two-dimensional artifact.

For your third sketch assignment, I want you to create your own Sunday sketch in a similar style.

  • Take a picture of your sketch and publish it as a post.
  • Give your post a funny or witty title.
  • Write a paragraph or two in which you explain the process whereby you came up with the idea for your Sunday sketch and the choices you made in realizing that idea as an actual sketch.
  • Include a link back to this prompt and tag it “sk2”

Sketch 1: Avatar

Due: 8/27

Tag: sk1

Objectives:

  • Very basic photo editing
  • Introduction to the concept of Creative Commons
  • Uploading and publishing to your new WordPress site
  • Visual images as representations of complex conceptual topics

Avatar

Once you’ve created your web site, you need an image to represent yourself and/or your site for the class: an avatar. Your avatar can be whatever you want it be but try to create something that both reflects your personality and speaks to the topic for this class in some way.

Start by choosing one or more of your own photos as the basis of the avatar, drawing something yourself and scanning it, or finding one or more Creative Commons-licensed images on Flickr that you can modify. (Make certain to keep a note for yourself of the URL for the photos you use if they are not your own.)

CC-licensed images

Creative Commons licenses work with copyright law so that creators can share their work in a way that allows others to use it with attribution. The video on the left gives a good overview of the concept of Creative Commons licensing. The one on the right gives more explanation of how they work. They are short and worth watching.

You can find CC-licensed images by choosing licensed images on Flickr or with an advanced Google image search.

Edit Photo

Crop and otherwise edit the photo(s) in a photo editing application (like Photoshop or Pixlr). You can create a layered or collage effect, if you’d like. Add your name on your badge in such a way that it’s legible — it can be your full name, just your first name, or the nickname you want to be called this semester.

Your final badge should be square and at least 512 pixels wide and high. Please make certain your badge is square so that it will fit into the design on the student sites page.

Publish

When you’re done, you’ll need to put the image two places, with an optional third:

First

Load the badge into your Media Library and publish it to your site in a blog post. (If adding it as a feature image means that the entire square image won’t display, then also insert the image into the post itself.)

Include information and links in the post about the source(s) for images included in your badge.

Write a paragraph or two about why you chose those images, what aspects of yourself and your interests are represented in your badge, and/or what difficulties you faced in creating the badge.

Please tag your post with the tag “sk1,” plus any additional tags that you think are appropriate.

Second

Go into your dashboard to Design > Customize > Site Identity. Load the image as your site icon (not as the logo).

Finally

If you do not already have a gravatar, create a gravatar account and load your avatar there. From then on, your avatar will show up as your picture when you leave comments here and on other students’ sites.

Sketch 3: Visual Note Taking

Due: 9/10
Tag: sk3

For your sketch assignment this week, I want you to create a set of visual notes for one day in one class (other than this one) that you are currently enrolled in. You do not need to take your visual notes in real time; in fact, I recommend that you don’t. I recommend that you go to your classes and take notes in whatever manner you normally do, then after class go through your notes and recreate them as visual notes.

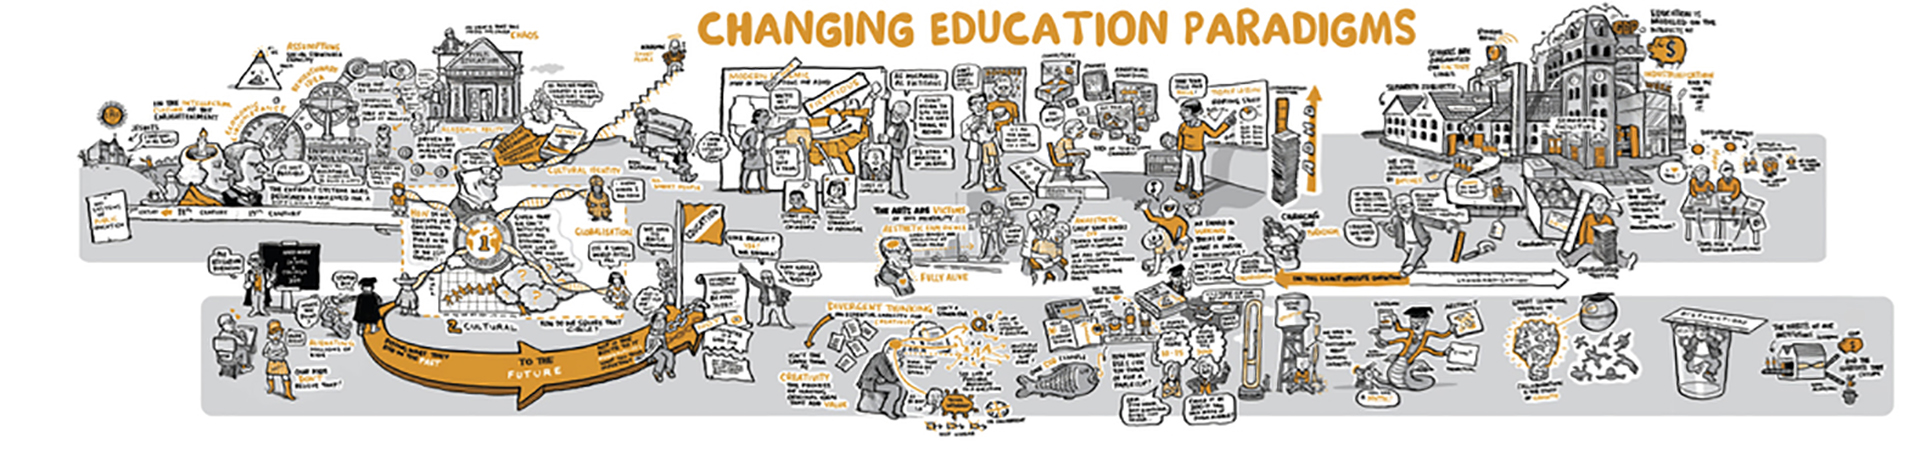
Below is an example of a professional illustrator creating a set of animated video notes to represent a lecture by Sir Ken Robinson on “Changing Education Paradigms”

You do not need to make a video like this, but only a static image.

You do not need to draw your notes in a digital environment, either, though you are certainly free to do so. If you prefer to doodle with pen, pencil, or marker on paper then do that and once you’re done with your drawing, just scan the pages as JPG files so you can upload them to your site. If you have an iPad or other tablet or would like to draw on your laptop or desktop, then you might try apps like GoodNotes, Procreate, Inkflow, or Adobe’s Sketchbook or search for other free/cheap drawing applications. I am completely tool agnostic on this assignment, so make your drawings in whatever manner make sense to you.

Your visual notes do not need to be polished or beautiful or supremely intricate, like the RSA Animate video above. Do try to take this assignment as an opportunity to really engage differently with your material – don’t just make a series of doodles that follow the outline of the lecture or discussion in your notes but try to translate the concepts and information into a new, visual set of notes. You might think about creating flowcharts or diagrams, which are also visual devices.

Once you’ve got your notes, load them onto your course site as a sketch post. Embed the images from your notes into the post and as you do, take a few moments to reflect on the process and then write a paragraph or two about what you learned during the process of creating your visual notes. Did it help you to understand the course content any differently or better to create notes visually rather than just as text? Did you discover anything new about yourself or the way you think in the process? Did you find it enjoyable or find some aspect of it particularly interesting? Someplace in your reflective text, create a link back to this blog post assignment.

Sketch 4: Combophoto

Due: 9/17

Tag: sk4

Stephen Mcmennamy is an Atlanta artist and Creative Director who was at the advertising firm BBDO. He first came to my attention when I saw his series of “combophotos” that splice together two different images to form a surreal new creation.

Here are a few examples from him:

cauliflower + poodle

paintbrush + spaghetti

bridge + guitar

Take a few moments to look through the images he’s posted on his site linked above or on his Tumblr or his Instagram. Then create your own square combophoto and publish it to your site. You can take your own photos, but probably you’ll want to use CC_licensed images you find on Flickr — make sure you give credit to the originals that you modify to create your combophoto.

The level of technical aptitude for this assignment is actually relatively small, just simple cropping and resizing. The greater part of the challenge is thinking creatively and finding images that you can work with. That said, note that Mcmennamy comes up with ideas and then specifically stages photos to combine, and he seems to often spend significant amounts of time shooting and selecting his images. You won’t have lots of time, models you can hire, or expensive photo equipment to work with, so I don’t necessarily expect your final images to be as polished and perfectly aligned as his are. More important is for you to be playful and come up with images that combine to create something funny or witty or striking.

To edit the two photos together, you can use whatever photo editing software you’d like. Pixlr is a good free web app, as is PicMonkey. Adobe Photoshop is also available for you to use on the computers in the Media Library on the 4th floor of the Woodruff Library.

Once you have your image, publish it in a post on your class site. Don’t forget to give it a funny or witty title! Tag your post “sk4“

Write a paragraph about how you went about choosing the two images you combined and why. What challenges did you face as you created your combophoto? What do you think your final image conveys?

Sketch 5: Triptych

Due: 9/24

Tag: sk5

In How to Read Nancy: The Elements of Comics in Three Easy Panels, Paul Karasik and Mark Newgarden carry out an extended discussion of comics through repeated analysis of the single Nancy strip by Ernie Bushmiller from August 8, 1959 (at the top of this post). They explain that “one of the least tangible yet most significant implements in the cartoonist’s toolbox is the varied use of rhythms.[…] One repetition makes a pair. But add another and the repetitions have become a series, the basic building block of all rhythm. A set of three has the smallest number of elements that can establish a pattern (as well as violate it). Three implies more to come” (134).

For this week’s sketch assignment, create your own triptych comic. As you compose your triptych, I most want you to focus on creating a story with a very clear beginning, middle, and end. Your story can be minimalist, impressionistic, comic, dark, weird or whatever you want it to be — but make sure that each panel of the triptych moves that story forward from beginning to middle to end.

You can draw your triptych, or create one using photographs, maybe along similar lines as the webcomic A Softer World, which ran weekly for about twelve years starting in Feb 2003. Emily and Joey published 1248 comics in that time, each consisting of three panels with photographs and words superimposed on them – often it seems to be a single image cropped into three panels, but sometimes it’s three photos taken as a series – and then the title of the comic appears when you hover your mouse over the comic (creating space for a sort of fourth panel or commentary). The comics tend to be quite dark.

I’m looking for compact and playful storytelling through both images and words. It’s an opportunity for you to play with irony, humor, and/or wit.

Add a paragraph reflecting on your triptych comic. What choices did you make in crafting your narrative? Describe the composition process a little bit. What was challenging about this assignment? How is crafting this sort of comic strip different or similar to other writing you’ve done this semester?

Sketch 6: What’s in your bag?

Due: 10/1

Tag: sk6

Find a relatively large empty space. Take your backpack, messenger bag, or whatever sort of bag you carry around with you regularly, empty all the contents out, and arrange them carefully so that they represent a visual snapshot of the stuff you tote around with you on a normal day. Then take a clear photo showing your bag and the stuff and upload it to your site.

Note that like the avatar or the literacy narrative, this too is a type of autobiographical composition. If you have something in your bag that is private, embarrassing, or for some other reason you don’t want it in the picture then make the editorial decision not to include it. Or vice versa: if you would like to assume a certain kind of persona then you might consider including items in your catalog that might be less than fully true.

Add some text to your post listing the items represented in your photo, preferably adding in a bit of explanatory and/or funny commentary along the way. This can be a paragraph of text or a list or whatever format seems most appropriate for you. When these sorts of posts are done by publications, like say The Verge or Timbuk2, they are often not so subtle efforts at product placement but for our purposes there is no reason for you to engage in such advertising games.

Along with the photo and your description of the items, include a paragraph reflecting on what it was like to craft a self-portrait through this photograph. How actually representative is this image of you as a person? What sorts of choices did you make in order to create the image? What was challenging about this assignment? Is representing yourself in a catalog of the stuff in your bag a type of writing? Why or why not?

Sketch 8: Data viz from everyday life

Due: 10/29

Tag: sk8

When Mason Currey wanted to understand how he could manage to produce more creative work despite the challenges of everyday life, he set about studying how a bunch of other famous creative people organized their daily lives and what routines they established for their own creative work with the assumption that there were valuable lessons there. Daily Rituals was the result of that research — and then a number of different people and organizations have set out to visualize the insights of that book so that we can see larger patterns in the midst of all this biographical information. Podio’s graphic, which is the feature image on this post, is one of those (check out their site for the interactive version)

For this sketch assignment, you will choose one concept in your life that you want to analyze, something that is not already easily and obviously measured, or doesn’t vary within the span of a day or a week (good categories: awesomeness, mindfulness, healthiness, creativity, productivity, and similar … bad categories: number of steps, hours of sleep, caloric intake, how good is my eyesight?). Decide on a set of about 5 categories that you can use to measure that concept in your life and track those categories for a week or more, then you will produce a visualization of the data that you have gathered and use that visualization to help you understand something about your own life that might not be obvious from your own day to day activities.

Tracking Data

If you’re looking for suggestions about what to track, browsing the “quantified self” tag at Lifehacker might be worthwhile.

Once you’ve got categories, create a spreadsheet where you can track those categories throughout the day. Either take notes in a journal or on your phone and enter the results into your spreadsheet at set intervals, or make the spreadsheet in Google Drive and access it from your phone, or use the site Trackthisforme, or install a tracker app on your mobile device (I found some by searching for “quantified self” apps).

In “How to Track Everything in Your Life Without Going Crazy” and “Fill Out This One-Minute Form Every Day and Find Out Why Your Life Sucks (or Doesn’t)” Adam Dachiss has some useful suggestions for measuring stuff in your life. “Why You Should be Tracking Your Habits and How to Do It” by Belle Beth Cooper is also useful. However, all three of those articles are a few years old now and might not be perfectly applicable.

Whatever method you use, the key activity is to decide what you are going to pay attention to and then to create a system that is manageable for your life for the span of a week wherein you will quantify information about your self or your behavior.

For example, one step of this process might be to decide to measure how happy you are and to create a spreadsheet with a column for “Happy.” Then when you wake up in the morning, while you’re waiting for the coffee to brew, you’ll pull up the spreadsheet and enter a number between 1 and 10 indicating how happy you feel. You will continue adding rows at some set interval (every hour maybe). You will probably have some columns that are a little less subjective than “how happy do I feel right now?” (like “how many times did I talk in class today?” or “how much time did I spend studying?” “how many minutes have I spent looking at my phone in the last hour?”). You can decide how objective or subjective your categories are, but recognize that those decisions will impact the sorts of conclusions you draw from this process.

For now, you just need to decide what you will track and then to be as meticulous and careful as you can be about actually tracking this information either directly into a spreadsheet or in a format that can easily be transferred into a spreadsheet at the end of the week.

Visualizing that data

Now that you have gathered your data, it’s time to analyze it further and visualize it.

With the data set that you’ve gathered, which is just for a week or so and only with a handful of variables, you probably won’t need a computer or special tools to analyze it. However, you might find loading your data into a spreadsheet (like in Excel) if you haven’t already been keeping it in that format will help you a lot to analyze it and see patterns in the data.

Because this is an assignment about collecting data about your own life, there is room for you to decide how “scientific” you want to be with your project. Even if you have never used spreadsheets for much of anything, try to quantify your data as much as you can and make an effort to be detailed and accurate with your information, but that said the types of data you chose to collect and the category you’ve decided to study will have a huge impact on the type of analysis you undertake. It is okay for you to have some more subjective categories and it’s okay if your final analysis or visualization is somewhat subjective too.

Tools

There are numerous methods you can use to create your visualization — anything from paper and crayons/markers/pencils to sophisticated data visualization software like Tableau. MS Excel also has some pretty sophisticated charts that you can create from your data. And there are also lots of free online tools that you can use too — it’s admittedly been a year or more since I really surveyed the set of free tools available, but I’d probably still recommend Infogram if you want a free web-based infographic maker and aren’t sure where to start.

For help deciding what type of chart or graph might be most effective in visualizing your data, consult the Data Viz Catalogue (it might be most helpful for you to switch to the “sort by functions” view at the top of the page).

Digital Images

Hand-drawn charts and graphs are perfectly 100% acceptable, if that’s what you prefer. However, please do not spend lots of time carefully crafting hand-drawn charts and then snap a crappy picture of them on your cell phone to post to the web. There are lots of scanners available on campus that you can use to scan your chart into a high-quality JPG image — I’d suggest that you take a quick trip to the Media Lab on the 4th floor of the library and scan your drawings. That space is underutilized and an excellent resource that you should know about.

If you create your visualizations with an online tool, just make sure that you can export them as a JPG image, or that you can at least take a good screenshot of your work.

Publish

Publish your charts as a sketch post to your site. Identify what conceptual issue you were tracking or what question you wanted to answer (or begin to answer). Include 2 or 3 paragraphs explaining what conclusions you have drawn from the data that you collected. Were you able to answer the question you had posed for yourself? What sorts of judgement calls did you face while gathering the data? Why did you choose to visualize your data in the manner that you did? What do these visualizations say about your own life? If you were to continue this project into the future, would you go about it in pretty much the way you have done this week or would you do things differently now that you have looked at the data to this point? Have you found this to be a valuable tool for self analysis?

Sketch 7: Quadriptych

due: 10/8

tag: sk7

You’ve made a one-panel image with your avatar, combined two images with your combophotos, and made a traditional three-panel comic like those that used to dominate the Sunday funnies sections of newspapers. This week, I’d like you to make a 4-panel comic like the ones that are currently dominating web comics.

As Peter Rubin argues in Wired, “Four-panel strips have been a fixture since early 20th-century newspaper comics like Mutt and Jeff and the concomitant appearance of yonkoma (“four-cell”) manga in Japan. It’s the perfect three-act-structure: You start at one end, develop conflict in the middle two panels, and resolve with a punch line at the end. But thanks to a number of factors—not least of which is the rise of Instagram and Reddit—a gridded, two-by-two variant has come to dominate the internet.” Notice that the four-panel comic, Rubin claims, still has a three-act structure.

You probably already know examples of such 4-panel web comics. You might check out the comics of Nathan Pyle or comics such as “Humpty Dumpty Had a Great Fall.”

WholesomeNsuchArt

Then make your own four-panel square comic. Just like with your triptych, you should still focus on telling a story with a beginning, middle, and end and you are still free to use photographs or to draw in whatever style you’d like. Focus, again, on compact, playful storytelling.

You can combine the four images into a single one or you can publish them to your post as separate images. In order to create a square in the WordPress block structure, you’ll simply need to add 2 “columns” blocks to your post and then hover over the top of each column block to add an image.

Step one: Add a Columns layout block
Step two: Add an image to each block

Column blocks are found in the “Layouts” section of the block selector. They allow you to format your blog posts with columns, to which you can add images or paragraphs of text or embed other elements and so on.

Like with your triptych, add a paragraph of text reflecting on your quadriptych comic. Describe the composition process a little bit. What was challenging about this assignment? How is crafting this sort of comic strip different or similar to the triptych? How was it different to have the middle act stretch across two panels rather than one? Why did you tell the kind of story that you did?

Sketch 11: Assemblies

Due: 12/3

Tag: sk11

For some unknown reason, the National Archives includes a document entitled Cocktail Construction Chart, which was created by the US Forest Service in 1974, showing recipes for a group of cocktails represented in the style of an architectural diagram.

For this week’s sketch, think about the work you’ve completed in this class and your own learning and thinking processes — then break all that down into component parts, represented in some sort of an architectural diagram like this one. I’m less interested in the quality of the drawing itself and more in your analytical ability to break down something complicated into a series of steps and to represent that as if in such a diagram.

Creating this diagram should be a key step towards completing your portfolio reflection letter (and I will encourage you to use the diagram as a key image in that letter). If you think about what you have learned this semester about yourself as a writer and reader, how can you represent that understanding as a single diagram, and how do the various pieces of writing you have done fit into that diagram to construct your vision?

css.php